About This Project
ABSTRACT
Trap and Treat® BOS 200® was applied at a site in a Permeable Reactive Barrier (PRB) configuration to manage offsite petroleum hydrocarbon contaminant flux and replace a non-performing existing PRB. Project objectives were realized within 6 months of installation.
PROJECT SNAPSHOT
• PRB Dimensions = 80 ft (perpendicular to fl ow) x 10 ft (parallel to fl ow)
• Lithology = Clayey silt till
• Depth to Water = 17 to 19 ft below ground surface (bgs)
• Contaminants = Gasoline range hydrocarbons (BTEX & 1,2-DCA), NAPL observed in soil (not measured in wells)
• Implementation Method = Top-down direct push injection
CHALLENGES & OBJECTIVES
• The site challenges included: difficult geologic and physical settings (Figure 1), the fact that multiple injection events had already occurred (elevated surfacing potential), NAPL was present, and that 1,2-DCA was present above the standard (12 μg/l).
• The objective of the remedial action was to create a proper reactive barrier at the property boundary to limit offsite migration until the site can be redeveloped.
PRELIMINARY APPROACH (PRE-RPI GROUP INVOLVEMENT)
• 1st Application: Colloidal Activated Carbon + Oxygen Releasing Material applied in 24 injection locations (3.2 ft spacing) in a single row over 3 discrete injection intervals.
• 2nd Application: Colloidal Activated Carbon + Oxygen Releasing Material applied in 17 injection locations (5 ft spacing) in a single row over 1 or 2 discrete injection intervals.
• 3rd Application: Sodium Persulfate + Oxygen Releasing Material applied in 8 injection locations (random spacing) in a single row over 2 discrete injection intervals.
PRELIMINARY APPROACH
• A Remedial Design Characterization (RDC) was performed after the Preliminary Approach was not successful. Six (6) boreholes were advanced within the PRB footprint. Twenty-seven (27) soil samples (4-5 samples per borehole) and 12 groundwater samples (2 per borehole) were collected to assess the saturated soil mass within the PRB but also how the dissolved mass was advancing through the cross section.
• Based upon the results of the RDC, a 4th Application was designed and implemented using the BOS 200® technology.
• 4th Application: BOS 200® applied in 81 injection locations (3.2 ft spacing) in 4 rows of points over 9 discrete injection intervals
RESULTS
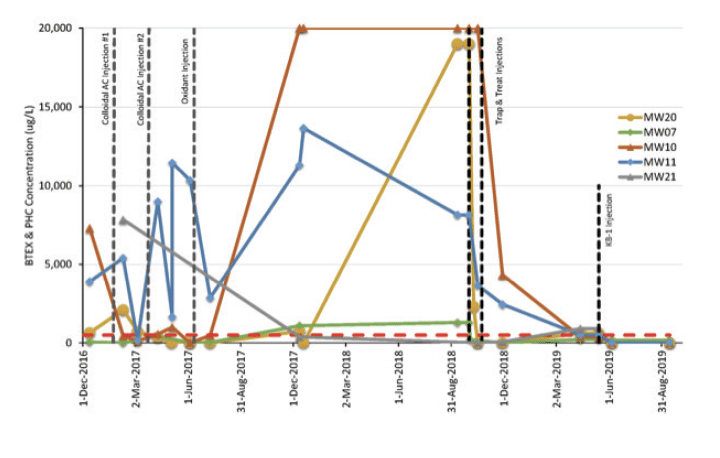
• The results from the first 3 project phases indicate mixed to poor results (Figure 2). Possibly this may have been due to poor characterization, design, or implementation techniques. The technology chosen for the 1st and 2nd phases is traditionally applied in course geologies (sands and gravels), and soil at this site is described as a clayey silt till. The technology chosen for the 3rd phase is not traditionally used in PRB applications.
• The RDC proved to be critical to the understanding of the conceptual site model. A proper design was developed that accounted for the elevated saturated soil mass present in the PRB area as well as the dissolved phase mass fluxing through the cross section.
• After the fourth application, the TPH and BTEX concentrations decreased over the next 6 months (Figure 2) and have met the site standards for multiple sampling events.
• KB-1 was applied in a limited area (MW-10) after the BOS 200® injections to reduce the 1,2-DCA levels that remained above the standard (Figure 3).
Figure 1. Site Map with BOS 200® Injection Locations (black) and RDC Locations (green)

Figure 2. BTEX & PHC (TPH) Concentrations over the Various Project Phases

Figure 3. 1,2-DCA Concentrations over the BOS 200® and KB-1 Injection Phases


